The sea as seen by SAR
For the last quarter century, meteorology and oceanography have been
making use of microwave remote-survey data from aeroplanes and satellites. As we know, the
advantage of using Synthetic Aperture Radar (SAR) is the ability to work night and day in
all meteorological conditions and with high spatial resolution. The Mediterranean Sea,
surrounded by islands and indented coastlines, has seen advantageous use of such
techniques, especially for small-scale (< 10 km) observation of marine and atmospheric
phenomena and for detecting and quantifying surface pollutants.
Since SAR sends a radar beam with an oblique angle of incidence, there
is a return signal only when the sea surface is rich in gravito-capillary waves
(centimeter wavelengths) produced by the wind, which back-diffuse sufficient energy to
produce images.
Use of SAR is particularly useful for:
a. observing and measuring wave motion and in general marine phenomena
influencing sea surface roughness (currents, vortices, internal waves etc.);
b. visualizing the spatial characteristics of the boundary layer of air
on the sea surface;
c. extracting the wind field on the sea at high spatial resolution;
d. detecting deliberate or accidental crude-oil spillages in the water.
Given the complexity of the phenomena arising at the sea surface,
mainly of an impulsive, intermittent nature, we are still far from fully understanding the
phenomena associated with the air-sea interaction. Thus the use, possible today, of SAR
images of the sea cannot be separated from knowledge of the mechanisms influencing the
images themselves. Resources still need to be earmarked for scientific research in this
sector.
Our project
This project consists of two separate but complementary aspects.
1 Basic research on physical mechanisms influencing the radar echo
2 Application of the SAR images to meteorological and oceanographical
problems like:
a. coastal meteorology (study of orographical effects on the wind);
b. atmospheric phenomena of turbulent or convective vertical transport;
c. study of the directional properties of wave motion;
d. pollution.
To reach the objectives listed above, an open-sea experiment is to be done during the
SRTM mission.
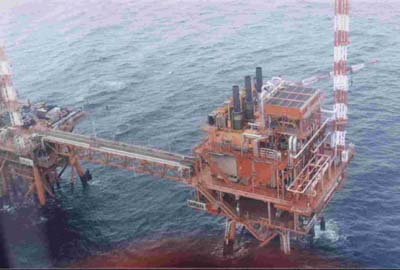
Agip "Barbara C" oil platform,
located over an approx.
100m seabed in the central Adriatic off Ancona.
The air-sea-microwave interaction experiment will be done on board the AGIP
"Barbara C" oil platform in the Adriatic Sea where scatterometric radars
operating in bands S, L, C
e Ku, ), ultrasonic triaxial anemometers and
Sodar Doppler phased arrays will be installed.
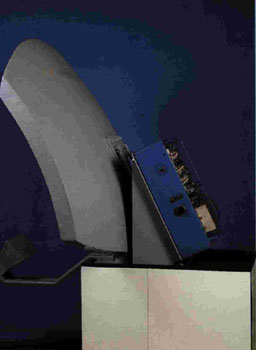
Coherent impulse scatterometer operating
in bands L, S e C
mod. ITS-600,
specially designed to measure backscattering from the
sea |
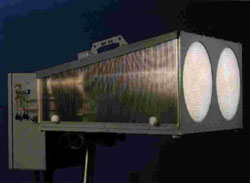
Coherent impulse scatterometer operating in
band Ku
mod. ITS-800,
specially designed to measure backscattering from the
sea. |
During the Shuttle mission, simultaneous measurements will be taken of
the radar backscatter from satellite and platform, wind direction, wind stress and sea and air temperatures.
The data obtained will supply time series of radar echoes, radar Doppler frequencies,
wind, wind stress and heat flows. The radar Doppler frequencies will yield frequency
spectra for the waves, which will be compared with those obtained from the SAR images.
Directional properties of the wave motion off the island of Lampedusa will also be
gathered, to study the properties of the transfer functions modulating the SAR radar echo
as a function of polarization and frequency.
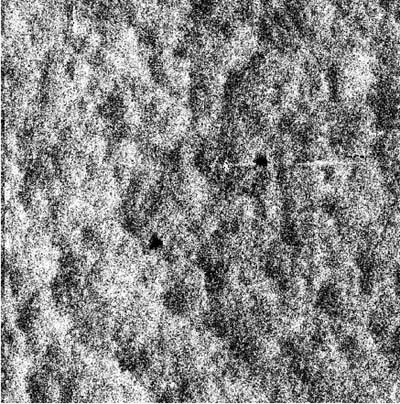
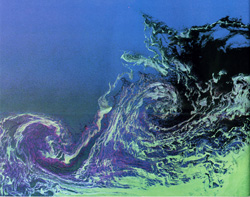
Detail
if SAR image in band C:
1024 x 1024 bytes with approx. 4.3 m interpixel. Whiteness
intensity is proportional
to radar cross-section. The centre shows the Acqua Alta platform
(light area);
the two dark spots are artificial slicks (two liters of oleic alcohol poured out).
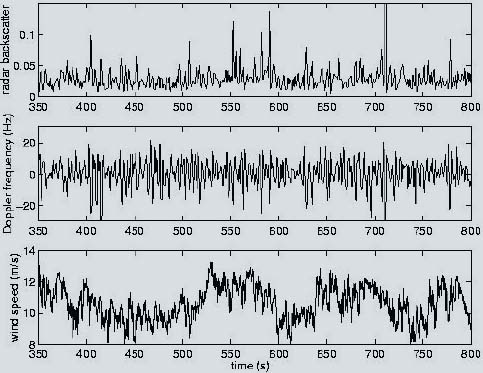
Examples of time series
obtained from measures from platform.
Top figure: time series of radar backscatter in band C.
Middle figure: Doppler radar frequency. Bottom figure: wind speed. (ISDGM-CNR).
Depending on the environmental conditions found during the experiment,
the following topics will be studied:
a. spatial structure of convective atmospheric systems over the sea
(resolution > 25 m);
b. spatial structure of wind stress in any wind system (resolution > 25 m);
c. spatial properties of the wind, derived from SAR measurements at approx. 1 km
resolution: atmospheric vorticity field and atmospheric vertical velocity fields (Ekman
pumping);
d. validation of electromagnetic and statistical models able to describe the radar echo
from the sea surface;
e. influence of wave age on wind stress and on radar echo, in deeper or shallower waters;
f. reconstruction of two-dimensional sea spectrum from SAR data, using inversion
techniques implemented by our research teams.
In relation to this last point, we have tackled the problem of retrieval of wave
spectra using the method of cross-spectra applied to the images in band X. The different
wavelength used to acquire the images and the different acquisition geometry of the sensor
are in fact parameters to be taken into account when analyzing a SAR image. It is
therefore important to understand how the cross-spectra method is related to these
parameters and how the environmental parameters, primarily wind velocity and direction,
affect the radar response.
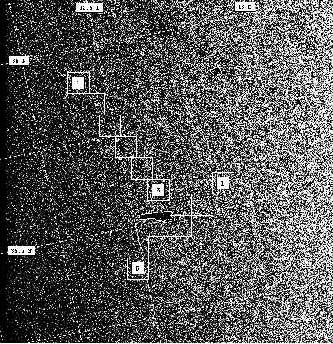
Figure 1: ERS-2 SAR image taken
on 13 November 1977 over Strait of Sicily, of an area round the island of Lampedusa. This
image was used to test the procedure of comparison between the classical inversion method
(Hasselmann & Hasselmann) and the cross-spectra method.
|
With an eye to the SAR mission, a procedure has been developed to draw a
comparison between the results obtained using a classical inversion method (Hasselmann
& Hasselmann) and those obtained using the cross-spectra method.
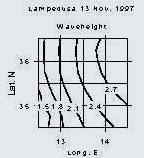
Figure 2: Wave height for an area of 2 x 2
degrees around the island of Lampedusa. This dataset, derived from the ECMWF as the output
of a wave model (WAM), is the first of the three parameters used for the inversion
procedure. |
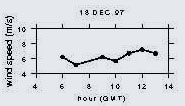
Figure 3: Wind
speed trend on 13 November 1997 (the direction remained constant at 300-310° ). The data were supplied by the Italian Air Force Meteorological
Service.
For the figures shown here, K=n*d k was
taken with d k=p /8*10-2 rad m-1. In
particular, fig. 5a shows the SAR spectrum observed; fig. 5b the one obtained using the HH
inversion method (with the WAM spectrum from fig. 2 used for initialization); fig. 5c
shows the result obtained by applying the cross-spectra method.
Good agreement can be noted between the result obtained with the HH
method, which needs a first-guess spectrum for initialization, and the one obtained with
the cross-spectra method, which by contrast requires no additional information. In both
cases it emerges that, by contrast with the WAM spectrum, the peak energy is such as to
mask the wind system distribution. This might be due to a different value from the
theoretical one to be allocated to the RAR transfer function in relation to wind speed.
Study of the relationship between MTF RAR and wind speed and direction will be one of the
objectives to pursue using the data collected in situ. Finally, it may be noted
that the swell system is not present in the sea spectrum recovered. The reason might be
the fact that the significant height (some 0.4 m in the WAM spectrum) is too low and
therefore cannot be picked up by the SAR aboard the ERS-2. |
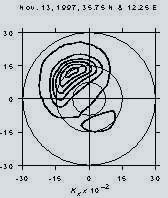
Figure 4: Wave spectrum for the node at
35.75°N, 12.5°E, including both a wind sea system and a swell moving SW. This dataset,
derived from the ECMWF as the output of a wave model (WAM), is used as the third input
parameter for the inversion procedure. |
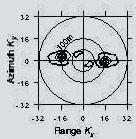
Figure 5a |
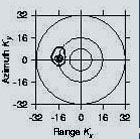
Figure 5b |
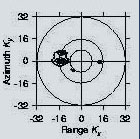
Figure 5c |
Activities are also scheduled to check models for describing
electromagnetic scattering from the sea surface. The actual in situ data acquired
at the same time as the SAR data are of fundamental importance here. The electromagnetic
models will be used to develop, verify and interpret the results obtained using inversion
algorithms, to recover the sea spectrum from the one in the SAR image.
Plans are to gather satellite data useful for describing the state of the atmosphere,
with particular reference to temperature, water vapor and liquid water content, the
presence and characteristics of cloud systems, and, possibly, the intensity of
precipitation at the surface. Data to be taken into consideration will be those from
Meteosat (visible and infrared radiometer, resolution approx. 2 km), DMSP-SSM/I (7-channel
microwave radiometer in the 19-85 GHz interval, resolution some 15 kilometers at the
frequency of 85 GHz), DMSP-SSM/T (microwave radiometer operating in the oxygen band). The
data from the radiometers will be analyzed to generate products on the state of the
atmosphere using the sea data (wind, surface temperature, waves) to model the effect of
the surface on the radiometric signal.
Bibliografia |