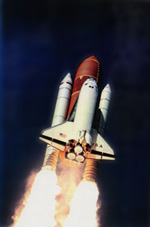
The first SIR-C/X-SAR mission, aboard STS-59 (Space Transportation System-59), and launched on the 9th April 1994, collected 65 hours of data during the ten days of mission, roughly corresponding to 66 millions square kilometers of observed Earth surface. The mission returned 47 terabits of data, the equivalent of 30.000 encyclopaedia volumes. The STS –59 achieved 100% of the SIR-C/X-SAR science objectives. In addition to taking high resolution data of all the planned sites, the scientific team was able to adjust the time-line in order to observe some phenomena in the very right moment they occurred on the Earth. For example, the inundation in the mid-west of the U.S. and in Germany, or Cyclone Odille as it formed in the Pacific Ocean or the thaw in Canada in spring.
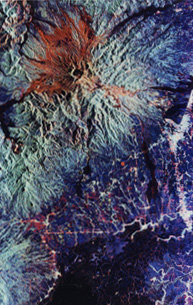
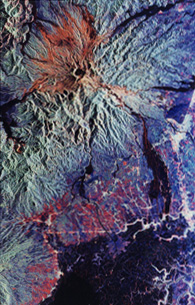
The second SIR-C/X-SAR mission took place in October 1994 with the same payload aboard STS-68. One of the most important objectives of the second flight was to acquire images of the same area of the first one to compare them, in particular, the Pinatubo mountain and volcanoes on Galapagos islands, the Etna and other areas where volcanic eruptions or other important phenomena had occurred.
Another great success of the SIR-C/X-SAR mission was to test a new image from satellite elaboration technique known as interferometry. Exploiting continuos passages of the antenna on the same area we can generate a DEM (Digital Elevation Model) of the observed area and to realise a high precision topographic map , just if the orbits are repeated with sufficient precision. In addition, it is possible to compare the images obtained by successive passages on the same site to survey variations. Both the SIR-C/X-SAR missions, then had a great success and started the many scientific missions whose main goal was to carefully observe our planet. |