This research program intends to
use the data from the SRTM mission, in both band X and band C, chiefly to confirm and
update DEMs (Digital Elevation Models) already in our possession. Additionally, given that
two different frequencies and a special system geometry are available, applications of
these data are innumerable and innovative.
The research can be summarized under four main heads of interest to the group of Italian
researchers, as follows.
1. Confirmation and comparison of DEMs in band X
and band C with data already available
Typically, the DEMs produced will be compared with several interferometric pairs obtained
from the European Space Agency's ERS-1 and ERS-2 satellites observing the same area one
day apart, during both ascending and descending orbits. Two examples of SAR images of the
areas of Etna and Ancona and the corresponding DEMs produced using these data are shown in
figures 1, 2 and 3. In particular, quantitative assessments will be made of the quality
degradation produced by the time shift and by residual atmospheric effects between the
multi-passage (ERS) and single-passage (SRTM) SAR interferometry.
|
|
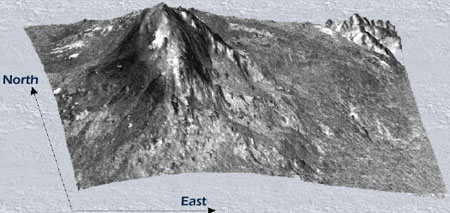
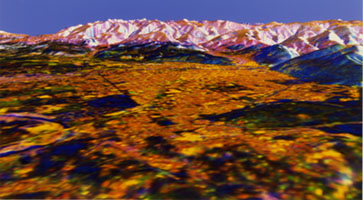
Figure 1: DEM of Etna (central image)
generated by combining several ERS-1/ERS-2 interferometric pairs, both ascending (image at
top left) and descending (image at top right). |
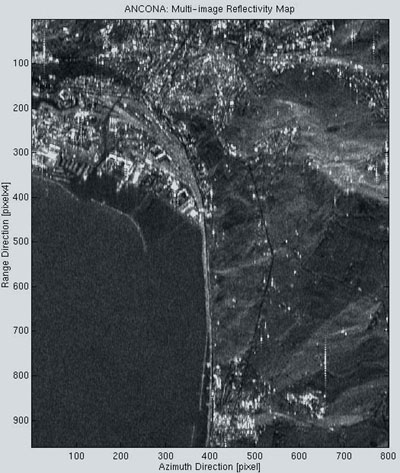
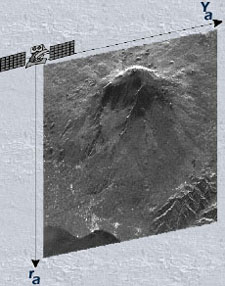
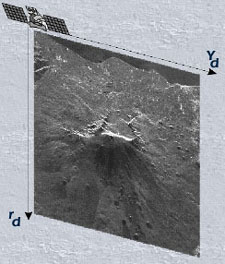
Figure 2: ERS
radar image of Ancona area.
Additionally, the DEMs relating to the
SRTM mission can be used:
- to compare/update DEMs already available;
- to identify vegetation height by comparing DEMs in band C and band
X (the two bands reach different depths);
- by combining DEMs in band X and C with other interferometric data
gathered at different times.
In particular, studies of this type in an Alpine
locality will allow comparison, in hard-to-reach mountain areas, of DEMs obtained using
different techniques. Additionally, the attempt will be made to put the data together to
calculate glacier movements.
2. Comparison of signals in band C and band X to
obtain image segmentation.
3. Analysis of interferometric data to identify
and compensate for possible phase errors caused by vibrations in the trellis supporting
the second antenna on the mission.
4. Identification using
"along track" interferometry of a ship's position and velocity in the
Mediterranean Sea.
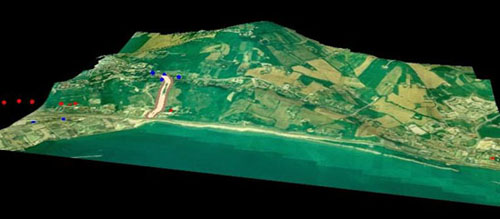
Figure 3: DEM of Ancona area generated on
the basis of 5 ERS-1/ERS-2 SAR interferograms.
By courtesy of Ancona Municipality and ESA-ESRIN |