
 |
San Rafael Glacier, Chile Interferometric
measurements by SIR-C/X-SAR were used to measure some of the fastest moving, most
inaccessible glaciers on earth, in Chile’s huge, remote Patagonia ice fields. |
courtesy of NASA/JPL |
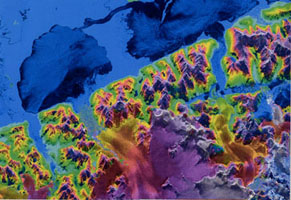
The imagery provided the first detailed measurements of the
mass and motion of the San Rafael glacier. The patagonian ice fields are the world’s
largest midlatitude ice masses and account for more than 60 percent of the southern
hemisphere’s glacial area outside of Antarctica. |
The ice fields offer essential information for
climatologists attempting to understand how glaciers respond on a global scale to changes
in climate, but the region’s inaccessibility and inhospitable climate have made
studies nearly impossible. Topographic data exist for only a few glaciers, and no data
exist for the vast interior of the ice fields. The SIR-C/X SAR interferometry was used to
generate a digital elevation model of the glaciers and a map of their ice motion. The data
were acquired from nearly the same position in space over three days in October 1994 as
space shuttle Endeavour flew over patagonian outlet glaciers of the San Rafael Laguna. The
left image is a digital elevation model of the scene, where color and saturation represent
terrain height (0 to 2,000 meters, or up to 6,561 feet) and brightness represents radar
response to varying terrain. Low elevations are shown in blue and high elevations are
shown in pink. High-resolution maps like these acquired over several years would allow
scientists to calculate long-term changes in the mass of the glacier.
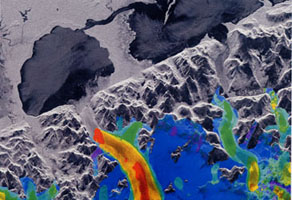
The right image is a map of ice motion parallel to the radar look direction (from the top
of the image). The colors indicate ice motion per day away from or toward the radar.
Purple indicates ice motion away from the radar at more than 6 centimeters (about 2
inches) and dark blue is ice motion toward or away from the radar at less than 6
centimeters per day. The colors from light blue to red indicate motion toward the radar:
light blue is 6 to 20 centimeters (2 to 8 inches); green is 20 to 45 centimeters (8 to 18
inches); yellow is 45 to 85 centimeters (1 8 to 33 inches); orange is 85 to 180
centimeters (33 to 71 inches); and red is greater than 180 centimeters (71 inches). The
largest velocities were recorded for the San Rafael glacier; other outlet glaciers exhibit
ice velocities of less than 1 meter (3 feet) per day. |
 |